NPM 2018 update: what changed and what to do now
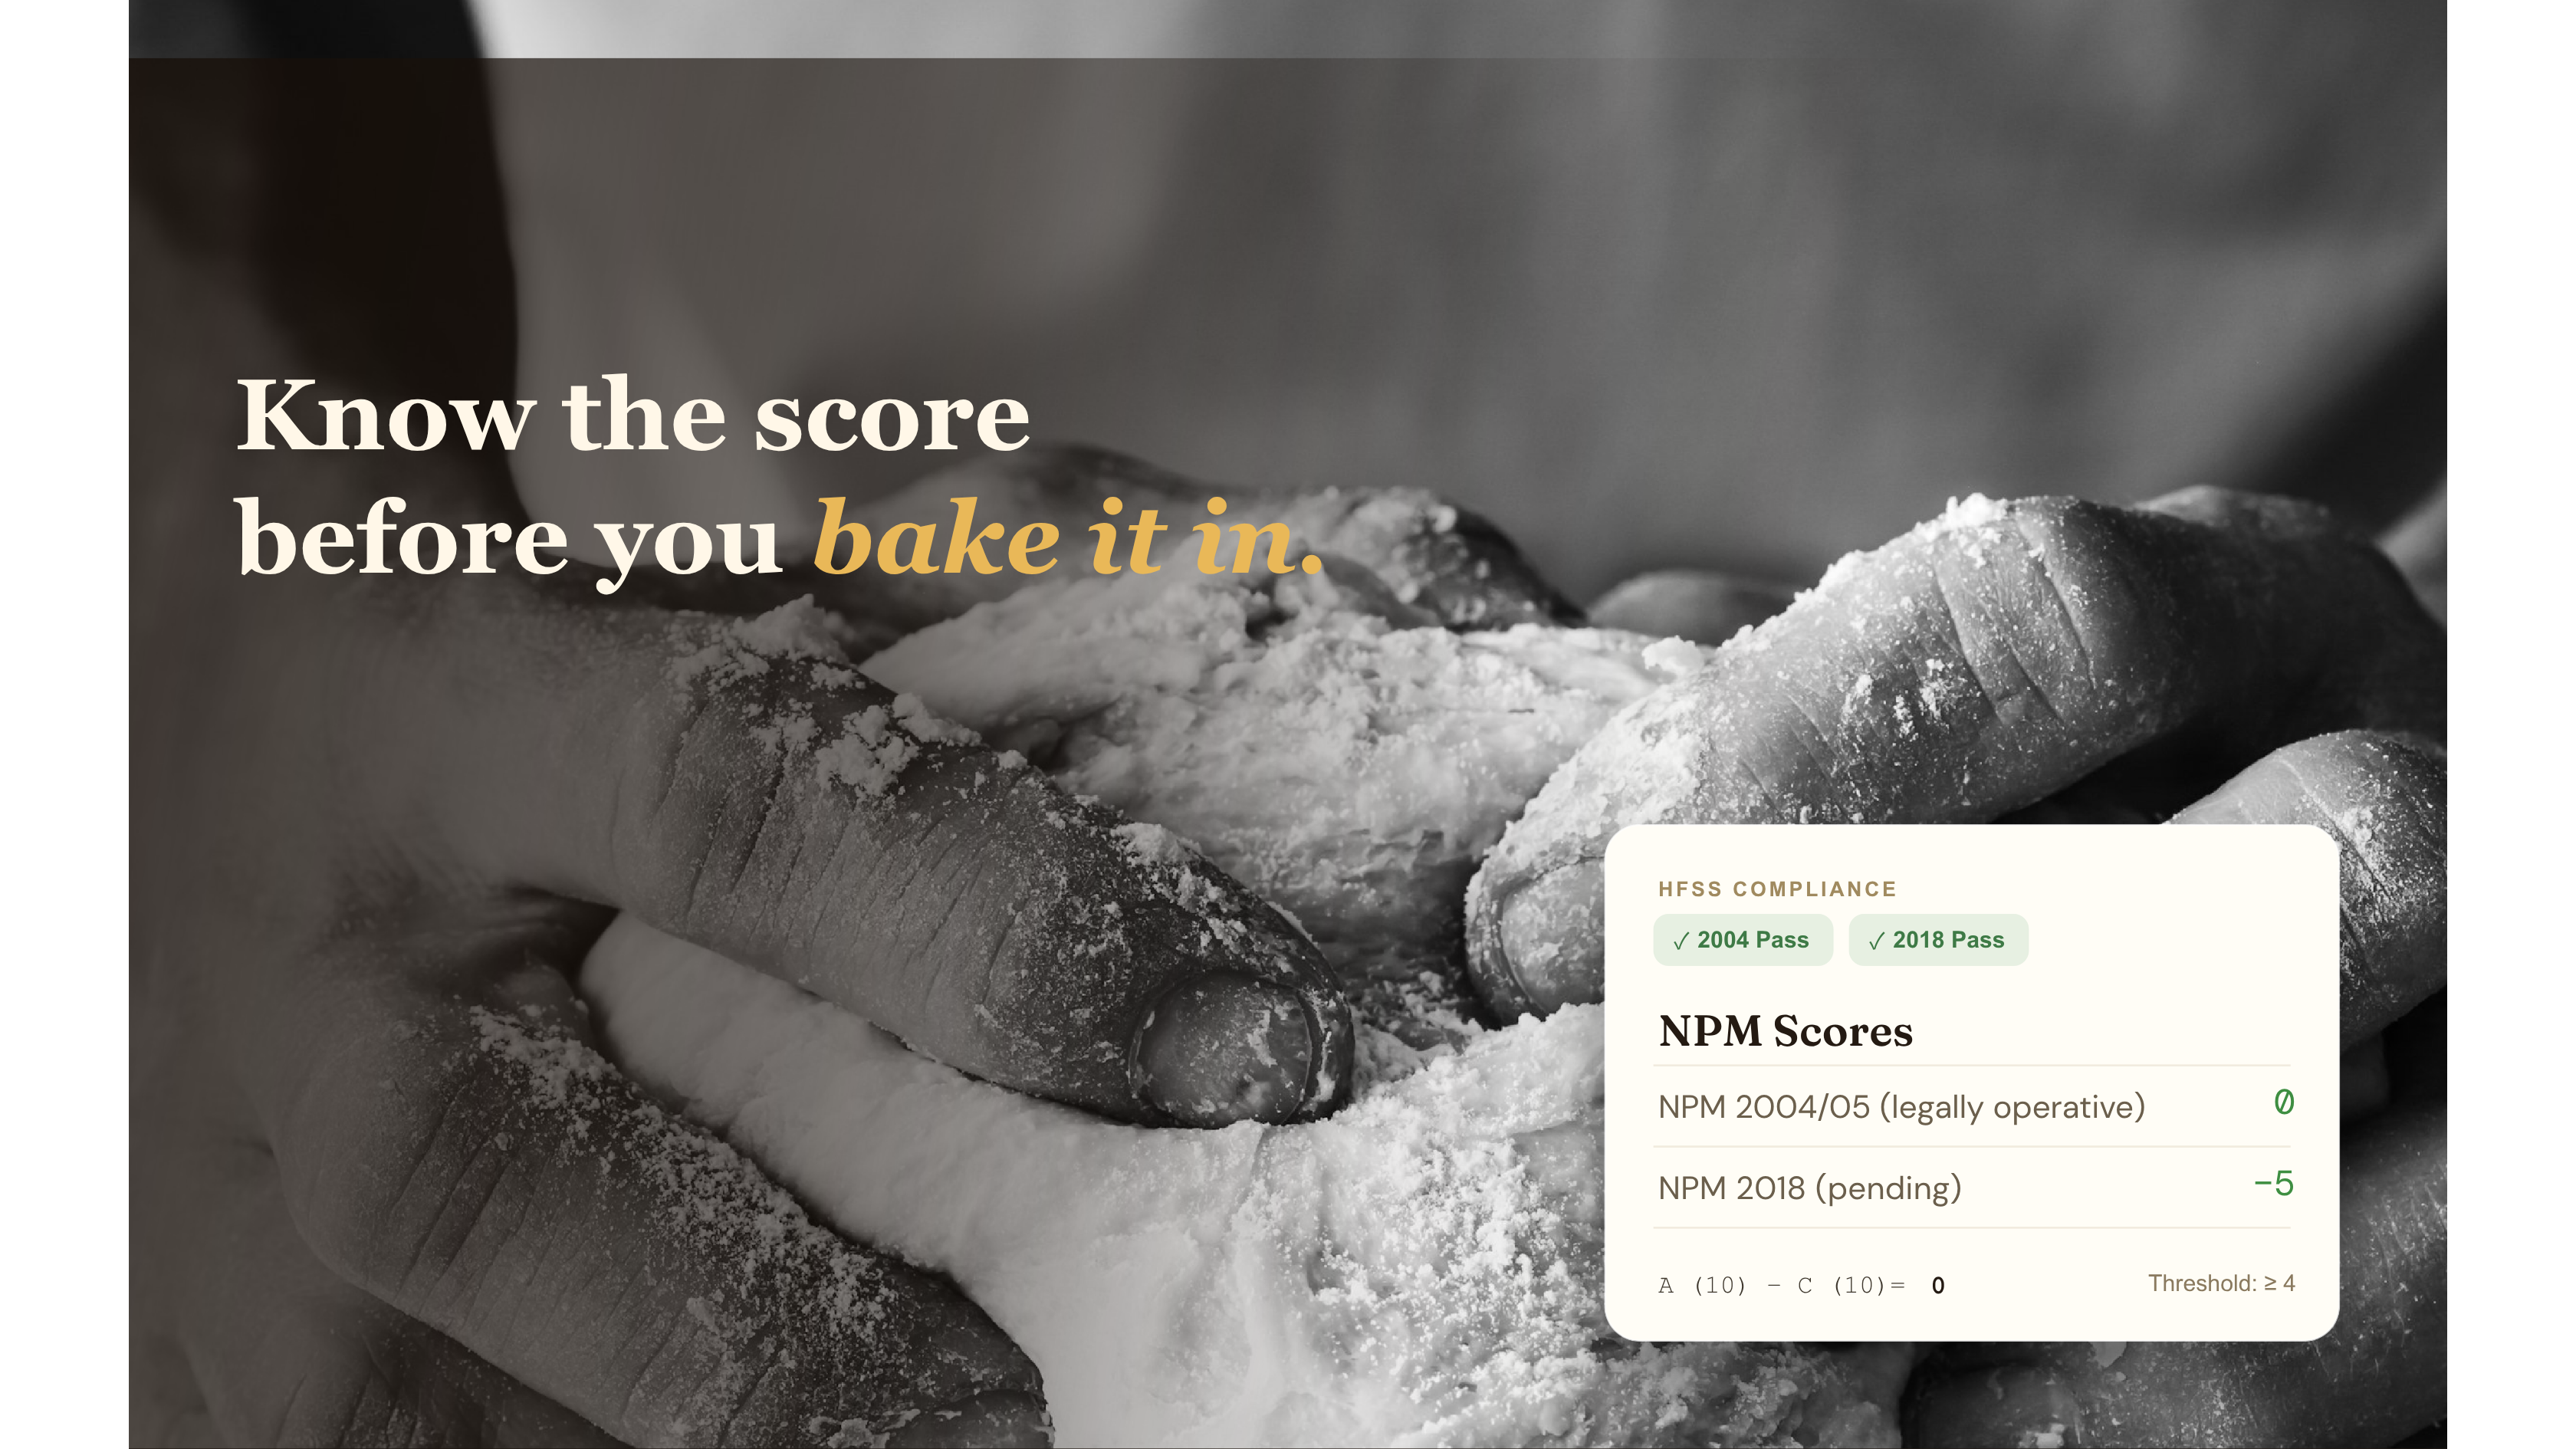
You cut the sugar in your fruit yoghurt three years ago to get it under the HFSS threshold. New recipe, new supplier, months of shelf-life testing. It passed. Then on 27 January 2026 the government published the NPM 2018, and the model that decides whether your product counts as "less healthy" changed underneath you.
Here's the number that got the industry's attention. Oxford Economics puts the cost of adapting to the new model at £2,812 per product. The government's own impact assessment estimated £53. That's roughly 50 times higher, and it's why the Food and Drink Federation is asking the government to think again.
This post is the practical version. What actually changed in the scoring, which products are most exposed, and how to recalculate your own score before anyone recalculates it for you.
Why this matters right now
The timing is awkward, and worth understanding before you do anything else.
The HFSS advertising restrictions (the 9pm TV watershed and the total ban on paid online ads for less healthy products) came into force UK-wide on 5 January 2026. Those restrictions run on the old NPM 2004/05 model. So a lot of brands spent 2024 and 2025 reformulating and re-checking against 2004/05, and some only finished as the rules went live.
Three weeks later, the government published NPM 2018. It's a stricter model, and it's the one likely to underpin the next round of HFSS rules.
Here's the part that gives you room to plan. NPM 2018 is published but it is not yet applied to any policy. The government ran a consultation on applying it to the advertising, promotion and placement restrictions, which closed at 11:59pm on 17 June 2026. If the government confirms the model (signals point to around September 2026) and legislates, the draft timeline floated a 12-month implementation window, which means updated HFSS rules using NPM 2018 could take effect as early as September 2027.
So the model is fixed, the policy is not, and you have a runway. That runway is the whole point of recalculating now.
What NPM 2018 actually is
The Nutrient Profiling Model is the scoring system the UK uses to decide whether a food or drink is "less healthy," and therefore in scope for HFSS advertising and promotion rules. It was built by the Food Standards Agency in 2004/05. NPM 2018 is the updated version, published in January 2026, aligned to newer dietary advice from the Scientific Advisory Committee on Nutrition (SACN), in particular on free sugars and fibre. The full scoring tables are set out in the government's NPM 2018 technical guidance.
The mechanics are the same as before. A product earns "A" points for energy, saturated fat, free sugars and salt, and "C" points for protein, fibre, and fruit, vegetables, nuts and seeds (FVNS). You subtract C from A. A food scores as less healthy at 4 points or more. A drink scores as less healthy at 1 point or more.
What changed is how some of those points are counted. Three changes do most of the work. (For how the new model treats genuinely nutrient-dense products, see why the NPM 2018 finally rewards both compliance and nutrient density.)
The three changes that move your score
1. Free sugars replace total sugars
This is the big one. Under NPM 2004/05 you scored sugar points on total sugars, straight off the back of pack. Under NPM 2018 you score on free sugars, which you have to calculate.
Free sugars include all added sugars, plus the sugars in honey, syrups and nectars, plus all the sugars naturally present in fruit and vegetable juices, purées, concentrates, powders and pastes. They exclude the lactose naturally present in milk and dairy, and the sugars locked inside whole and dried fruit and vegetables.
That cuts two ways, and which way it cuts for your product is exactly why you can't assume.
A plain dairy yoghurt sweetened only with its own lactose may score better under NPM 2018, because lactose isn't a free sugar. A product that swapped refined sugar for fruit juice, purée or concentrate to look cleaner on the label may score worse, because those fruit-derived sugars now count as free sugars. Drinks feel this most sharply, since any juice content lands squarely in the free sugars total.
There's a data cost too. Free sugars aren't on the label. You calculate them from recipe-level data using the government's decision trees, which means you need to know exactly where every gram of sugar in the product comes from. If cutting free sugars is on your roadmap, what to replace when you cut sucrose covers the functional gaps (bulk, browning, texture, preservation) you'll need to fill.
2. Fibre now scores up to 10 points, and only by the AOAC method
Under NPM 2004/05, fibre earned a maximum of 5 C-points. Under NPM 2018 the ceiling doubles to 10. For genuinely high-fibre products, that's a real chance to offset a heavy A-point load and pull back under the threshold.
Two conditions come with it. First, only fibre measured by the AOAC method counts. The older NSP (Englyst) figure is no longer accepted, so if your spec sheet carries an NSP value you'll need the AOAC figure or a proper conversion. Second, fibre still isn't part of mandatory labelling, so you need lab-verified AOAC data to claim those points at all.
If you work with beverages or functional products where fibre is doing real work in the formulation, this change is the one that can help you, though getting fibre into a drink brings its own problems around mouthfeel, stability and what you're actually allowed to claim.
3. Protein scoring shifts slightly
Protein still caps at 5 C-points. The thresholds moved up a little (you now need marginally more protein per 100g to earn each point), so this is the smallest of the three changes. Don't build a reformulation around it.
The rule worth remembering carries straight over from 2004/05: if a product scores 11 or more A-points, it can't count its protein points at all, unless it also scores the full 5 points for FVNS. High-sugar, high-fat products don't get to buy their way back with protein alone.
Two smaller updates round it out. Seeds now count alongside fruit, vegetables and nuts in the FVNS component. And salt is expressed as salt in grams rather than sodium in milligrams, which makes the calculation easier to read but doesn't change the underlying threshold.
Which products are most exposed
Government modelling after the consultation showed the model bites unevenly. Around 6 percentage points fewer foods pass, and around 21 percentage points fewer drinks pass, for an overall drop of about 8 percentage points. Drinks are hit hardest, driven almost entirely by the free sugars change catching juice-based content.
The FDF's research named the everyday products caught by the shift, and they aren't what you'd expect. High-fibre breakfast cereals, fruit yoghurts, lower-sugar cakes and lower-salt crisps would all fail the proposed model. Several of these are the "healthier swap" products brands built specifically to sit under the old threshold.
If your product falls into any of these groups, treat it as a priority for recalculation:
- Drinks with any juice, purée or concentrate content. The free sugars change plus the drink threshold of 1 point makes this the most exposed category by a distance.
- Fruit yoghurts and fruit-based dairy. Fruit purée sugars now count as free sugars, even where the pack says "no added sugar."
- Breakfast cereals, including high-fibre ones. Added sugars, honey and syrups push A-points up, and the fibre benefit may not fully offset them.
- Composite foods (soups, sauces, ready meals, fruit-based blends). These are the hardest to score, because both free sugars and FVNS need full recipe data rather than a label.
- Anything sitting just under the line today. A food scoring 3 or a drink scoring 0 under 2004/05 has almost no margin.
How to recalculate your score under NPM 2018
The method is the same shape as before. The work is in the two components you can't read off a label.
Step 1: gather your per-100g values. Energy in kJ, saturated fat, salt, protein and AOAC fibre all come from your nutrition data (check the fibre figure is AOAC, not NSP). Free sugars and FVNS you calculate from the recipe.
Step 2: score your A-points. Award up to 10 points each for energy, saturated fat, free sugars and salt, using the NPM 2018 points table. Free sugars, for example, score 1 point above 0.9g per 100g, rising to 10 points above 9.3g.
Step 3: score your C-points. Up to 5 for protein, up to 5 for FVNS (you need more than 40g per 100g of qualifying content to score anything here), and up to 10 for AOAC fibre.
Step 4: apply the protein cap. If your A-points total 11 or more and your FVNS score is below 5, drop your protein points before you subtract.
Step 5: subtract and read the result. Score equals total A-points minus total C-points. A food is less healthy at 4 or more. A drink is less healthy at 1 or more.
Here's a worked fruit yoghurt, per 100g as sold, to show where the pressure sits:
- Energy 430 kJ: 1 A-point
- Saturated fat 1.8g: 1 A-point
- Free sugars 5g (from fruit purée and a little added sugar): 5 A-points
- Salt 0.1g: 0 A-points
- Total A-points: 7
- Protein 4g: 2 C-points
- FVNS 10g (below the 40g threshold): 0 C-points
- AOAC fibre 1g: 1 C-point
- Total C-points: 3
Final score: 7 minus 3 equals 4. That's a fail for a food.
Notice what carried the score. The 5 free-sugar points came from a figure that isn't on the label, and the fruit content wasn't high enough to earn a single FVNS point back. Change nothing but the sugar accounting, and this product moves across the line. That's the whole story of NPM 2018 in one calculation.
What this means for your team
There's no need to reformulate anything this quarter. The job for now is to know where you stand before the consultation outcome lands.
Score your range against NPM 2018 now, starting with the exposed categories above and any product currently sitting within a point of the threshold. Do it at product level, not category level, because category averages hide the individual products that flip.
Get your free sugars and FVNS numbers from recipe data, not estimates. Those two components decide most borderline cases, and they're the ones a rushed calculation gets wrong. While you're in the spec, confirm your fibre figure is AOAC.
Then use the runway. If a product fails under 2018 but the rules don't bite until 2027, you have time to plan a proper reformulation rather than a panicked one. And if you have real cost or product-availability evidence, the industry response to this model is still live, so it's worth feeding into the FDF or your trade body.
The brands that come out of this well will be the ones who modelled early and made deliberate choices. The ones who wait for the legislation will be reformulating against a deadline.
Frequently asked questions
What is the difference between NPM 2004 and NPM 2018?
Both models score products on the same A-points and C-points structure, but NPM 2018 changes three things: it scores sugar on free sugars rather than total sugars, it raises the maximum fibre score from 5 points to 10 (AOAC method only), and it nudges the protein thresholds up slightly. NPM 2018 also adds seeds to the fruit, vegetables and nuts component and expresses salt in grams instead of sodium in milligrams. Overall, NPM 2018 is more restrictive, with the biggest impact on drinks.
When does NPM 2018 come into force for HFSS advertising?
It hasn't yet. NPM 2018 was published on 27 January 2026 but is not applied to any policy. HFSS advertising, promotion and placement rules still run on NPM 2004/05. The government consulted on applying NPM 2018 to those rules, with the consultation closing on 17 June 2026. If the model is confirmed (expected around September 2026) and legislated with the floated 12-month implementation period, updated rules could take effect from around September 2027.
Does NPM 2018 affect front-of-pack labelling?
Not directly, and not yet. NPM 2018 governs HFSS classification for advertising, promotion and placement, not the traffic-light front-of-pack scheme, which uses its own separate thresholds and remains voluntary. Some health bodies have argued the NPM should also apply to health and nutrition claims and labelling in future, but that isn't current policy.
My product passed HFSS under NPM 2004. Will it still pass under NPM 2018?
You can't assume either way, which is the honest answer. A plain dairy product may score better under NPM 2018, because lactose isn't counted as a free sugar. A product sweetened with fruit juice, purée or concentrate will likely score worse, because those sugars now count. Drinks are the most likely to move from pass to fail. The only reliable way to know is to recalculate at product level.
How do I calculate my product's NPM 2018 score?
Total your A-points (energy, saturated fat, free sugars, salt) and subtract your C-points (protein, fruit/vegetables/nuts/seeds, AOAC fibre), using the NPM 2018 points tables. If A-points reach 11 or more and FVNS scores below 5, exclude protein before subtracting. A food is "less healthy" at 4 points or more, a drink at 1 or more. The two components that need recipe-level data, and cause most errors, are free sugars and FVNS, since neither appears on standard nutrition labelling.
Nibblr calculates your NPM 2018 score in real time as you build or adjust your recipe, so you can see the effect of every ingredient change before you commit to it. Try it here for a month for free by clicking here.